5.6 KiB
This document was last updated for go1.16 but probably still applies to older/newer versions for the most parts.
Stack Traces in Go
Stack traces play a critical role in Go profiling. So let's try to understand them to see how they might impact the overhead and accuracy of our profiles.
Introduction
All Go profilers work by collecting samples of stack trace and putting them into pprof profiles. Ignoring some details, a pprof profile is just a frequency table of stack traces like shown below:
| stack trace | count |
|---|---|
| main;foo | 5 |
| main;foo;bar | 3 |
| main;foobar | 4 |
Let's zoom in on the first stack trace in the table above: main;foo. A Go developer will usually be more familiar with seeing a stack trace like this as rendered by panic() or runtime.Stack() as shown below:
goroutine 1 [running]:
main.foo(...)
	/path/to/go-profiler-notes/examples/stack-trace/main.go:9
main.main()
	/path/to/go-profiler-notes/examples/stack-trace/main.go:5 +0x3a
This text format has been described elsewhere so we won't discuss the details of it here. Instead we'll dive deeper into the source of this data.
Goroutine Stack
As the name implies, stack traces originate from "the stack". Even so the details vary, most programming languages have a concept of a stack and use it to store things like local variables, arguments and return values and return addresses. Generating a stack trace usually involves navigating the stack in a process known as Unwinding that will be described in more detail later on.
Platforms like x86-64 define a stack layout and calling convention for C and encourage other programming languages to adopt it for interoperability. Go doesn't follow these conventions, and instead uses its own idiosyncratic calling convention. Future versions of Go (1.17?) will adopt another register-based convention that will increase performance. However compatibility with platform conventions is not planned as it would negatively impact goroutine scalability.
Even today, Go's stack layout is slightly different on different platforms. To keep things manageable, we'll assume that we're on x86-64 for the remainder of this note.
Stack Layout
Now let's take a closer look at the stack. Every goroutine has its own stack that is at least 2 KiB and grows from a high memory address towards lower memory addresses. This can be a bit confusing and is mostly a historical convention from a time where memory was so limited that one had to worry about the stack colliding with other memory regions used by the program.
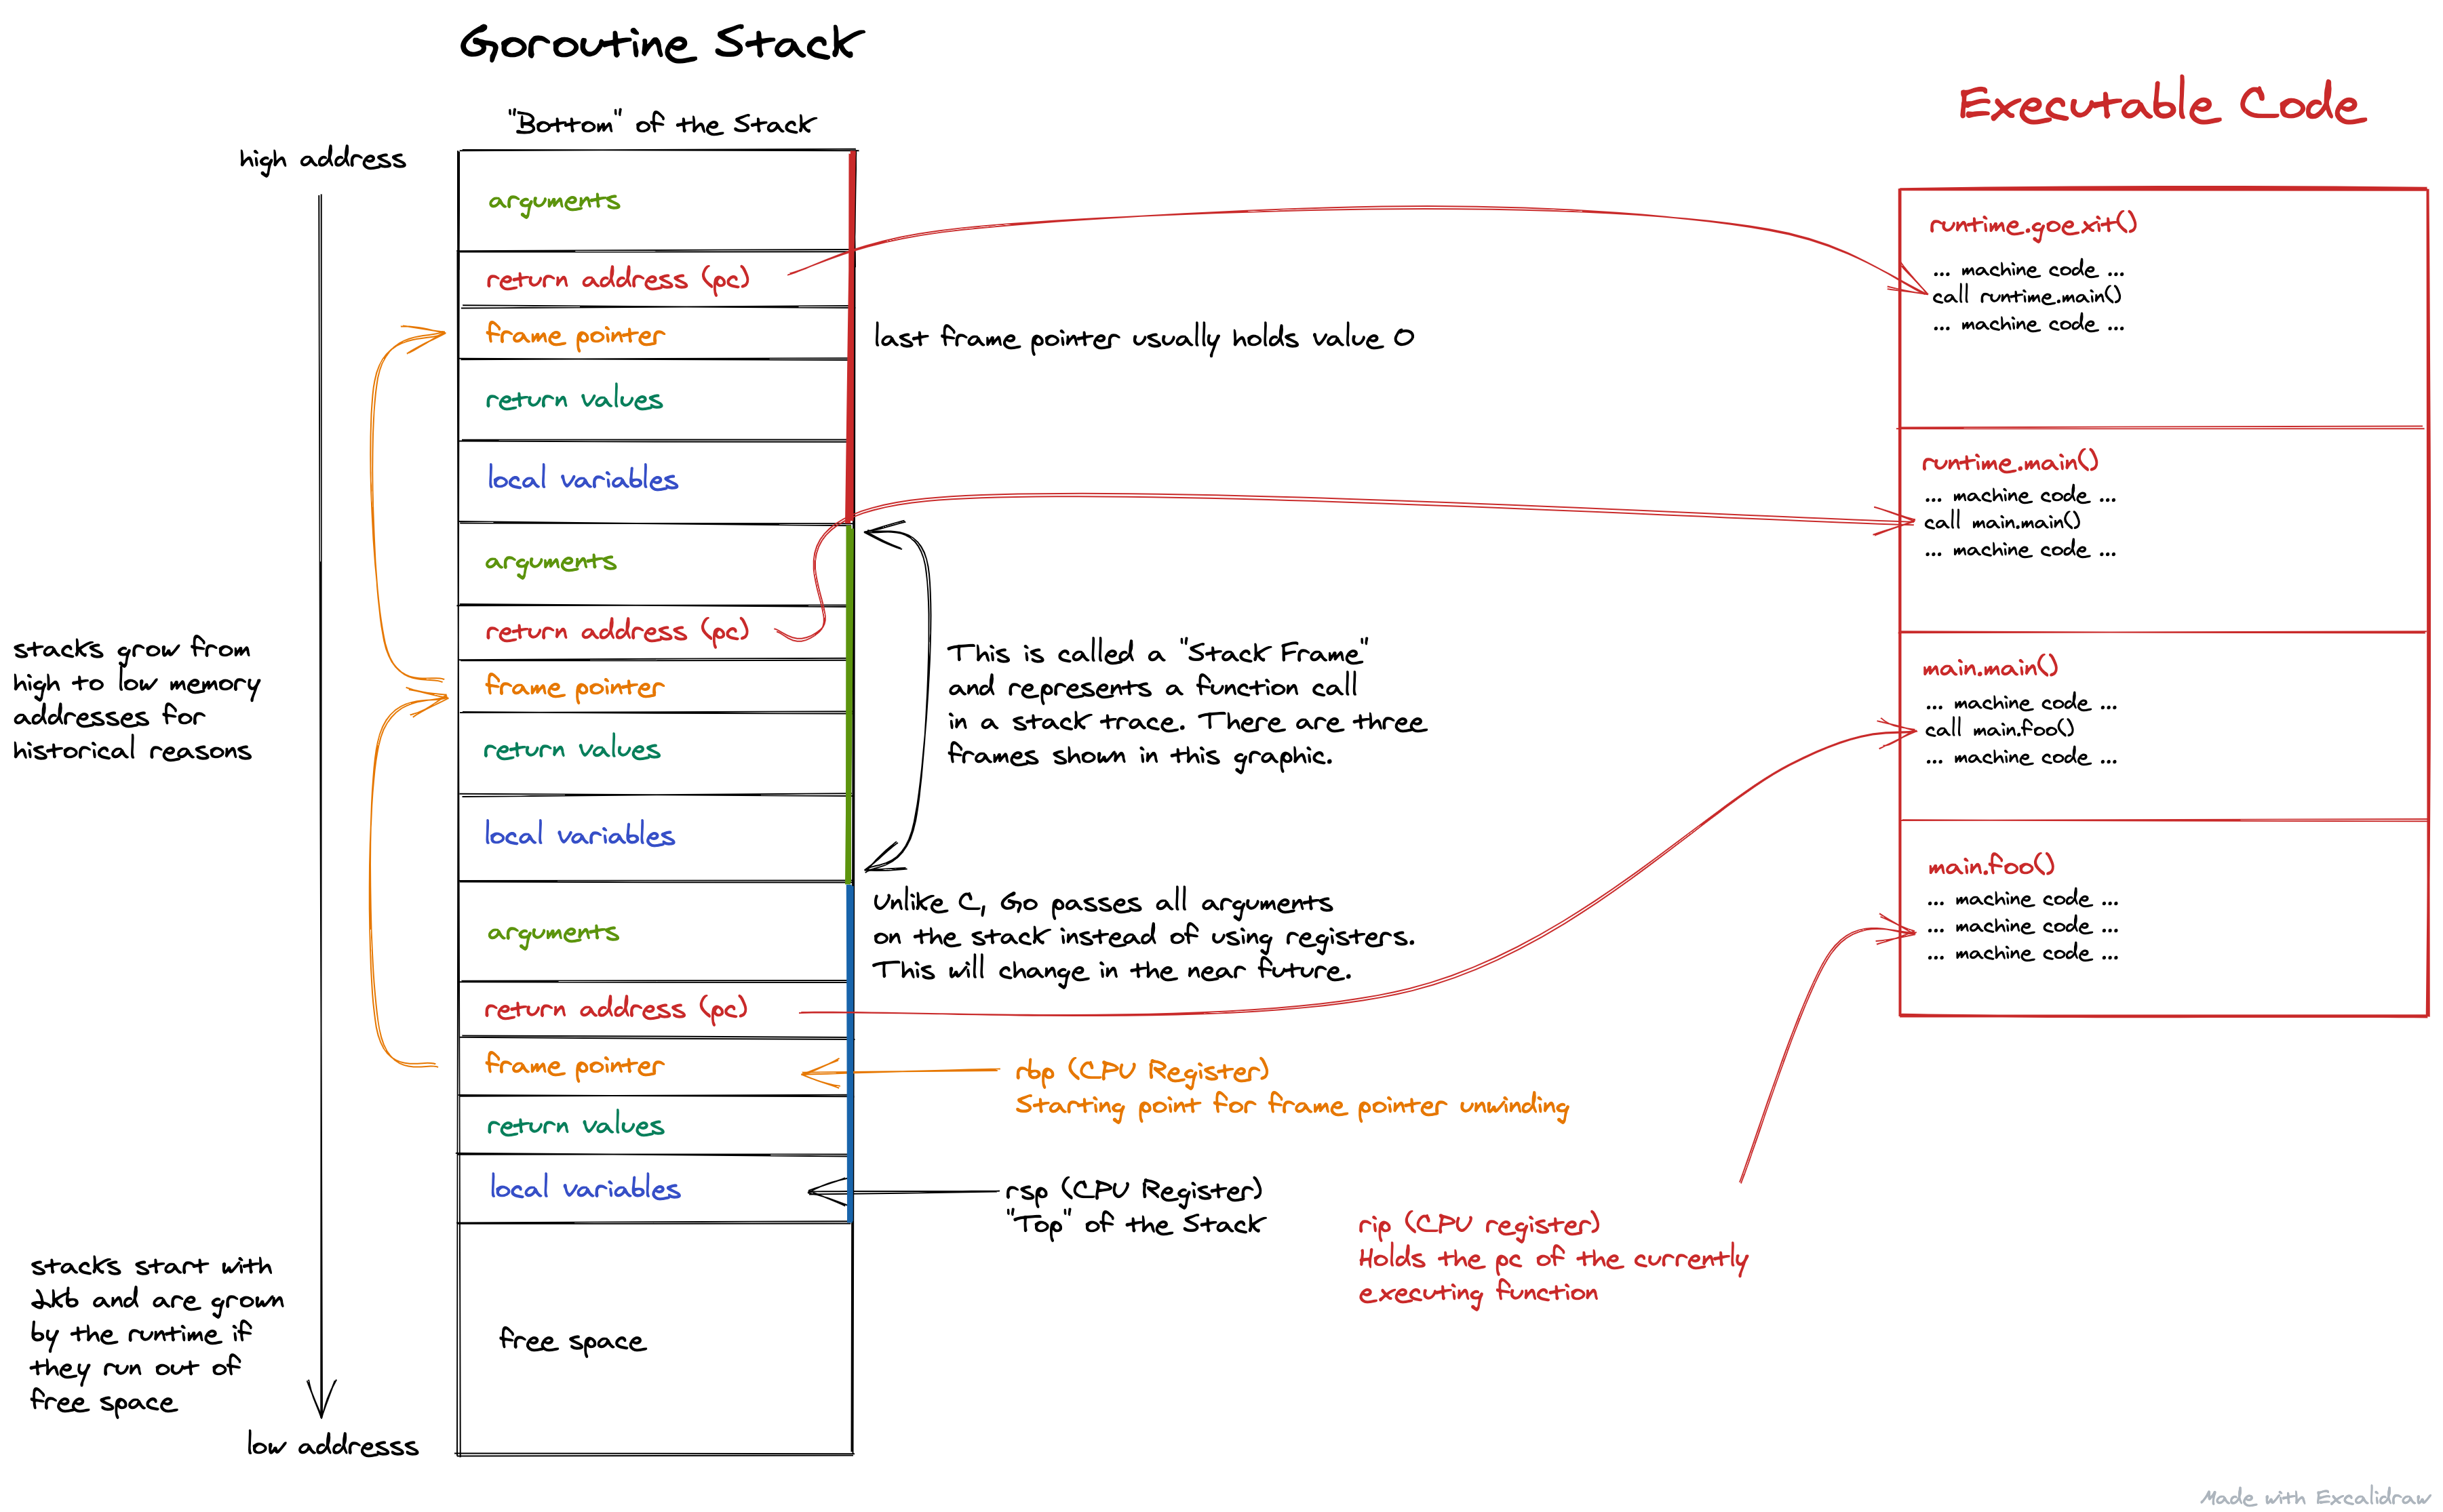
There is a lot going on in the picture above, but for now let's focus on the things highlighted in red. To get a stack trace, the first thing we need is the current program counter (pc) which identifies the function that is currently being executed. This is found in a CPU register called rip (instruction pointer register) that points to another region of memory that holds the executable machine code of our program. If you're not familiar with registers, you can think of them as special CPU variables that are incredibly fast to access.
The next step is to find the program counters of all the callers of the current function, i.e. all the return address (pc) values that are also highlighted in red. There are various techniques for doing, which are described in the Unwinding section. The end result is a list of program counters that represent your stack trace. In fact, it's exactly the same list you can get from runtime.Callers() within your program. Last but not least, these pc values are usually translated into human readable file/line/function names as described in the Symbolization section below.
Real Example
Looking at pretty pictures can be good way to get a high level understanding of the stack, but it has its limits. Sometimes you need to look at the raw bits & bytes in order to get a full understanding. If you're interested in that, keep reading. Otherwise feel free to skip ahead to the next section.
The best way to look at real Go stacks is to use delve debugger. It allows you to set breakpoints in any part of your program in order to poke at variables, arguments and even raw memory of your program.
Unwinding
Frame Pointers
To be written ...
.gopclntab
To be written ...
DWARF
To be written ...
Symbolization
To be written ...
Overhead
To be written ...
Accuracy
To be written ...
Frame Pointer Race Condition
To be written ...
Goroutine Stack Truncation
To be written ...
cgo
To be written ...
pprof Labels
To be written ...
Disclaimers
I'm felixge and work at Datadog on Continuous Profiling for Go. You should check it out. We're also hiring : ).
The information on this page is believed to be correct, but no warranty is provided. Feedback is welcome!