20 KiB
🚧 This note is still work in progress, please come back later! 🚧
This document was last updated for go1.16.3 but probably still applies to older/newer versions for the most parts.
Stack Traces in Go
Stack traces play a critical role in Go profiling. So let's try to understand them to see how they might impact the overhead and accuracy of our profiles.
Introduction
All Go profilers work by collecting samples of stack traces and putting them into pprof profiles. Ignoring some details, a pprof profile is just a frequency table of stack traces like shown below:
| stack trace | count |
|---|---|
| main;foo | 5 |
| main;foo;bar | 3 |
| main;foobar | 4 |
Let's zoom in on the first stack trace in the table above: main;foo. A Go developer will usually be more familiar with seeing a stack trace like this as rendered by panic() or runtime.Stack() as shown below:
goroutine 1 [running]:
main.foo(...)
	/path/to/go-profiler-notes/examples/stack-trace/main.go:9
main.main()
	/path/to/go-profiler-notes/examples/stack-trace/main.go:5 +0x3a
This text format has been described elsewhere so we won't discuss the details of it here. Instead we'll dive deeper into the source of this data.
Goroutine Stack
As the name implies, stack traces originate from "the stack". Even so the details vary, most programming languages have a concept of a stack and use it to store things like local variables, arguments, return values and return addresses. Generating a stack trace usually involves navigating the stack in a process known as Unwinding that will be described in more detail later on.
Platforms like x86-64 define a stack layout and calling convention for C and encourage other programming languages to adopt it for interoperability. Go doesn't follow these conventions, and instead uses its own idiosyncratic calling convention. Future versions of Go (1.17?) will adopt a more traditional register-based convention that will improve performance . However even the new convention won't be platform-compatible as that would negatively impact goroutine scalability.
Go's stack layout is slightly different on different platforms. To keep things manageable, we'll assume that we're on x86-64 for the remainder of this note.
Stack Layout
Now let's take a closer look at the stack. Every goroutine has its own stack that is at least 2 KiB and grows from a high memory address towards lower memory addresses. This can be a bit confusing and is mostly a historical convention from a time when the address space was so limited that one had to worry about the stack colliding with other memory regions used by the program.
The picture below shows the stack of a sample goroutine that is currently calling main.foo() like our example above:
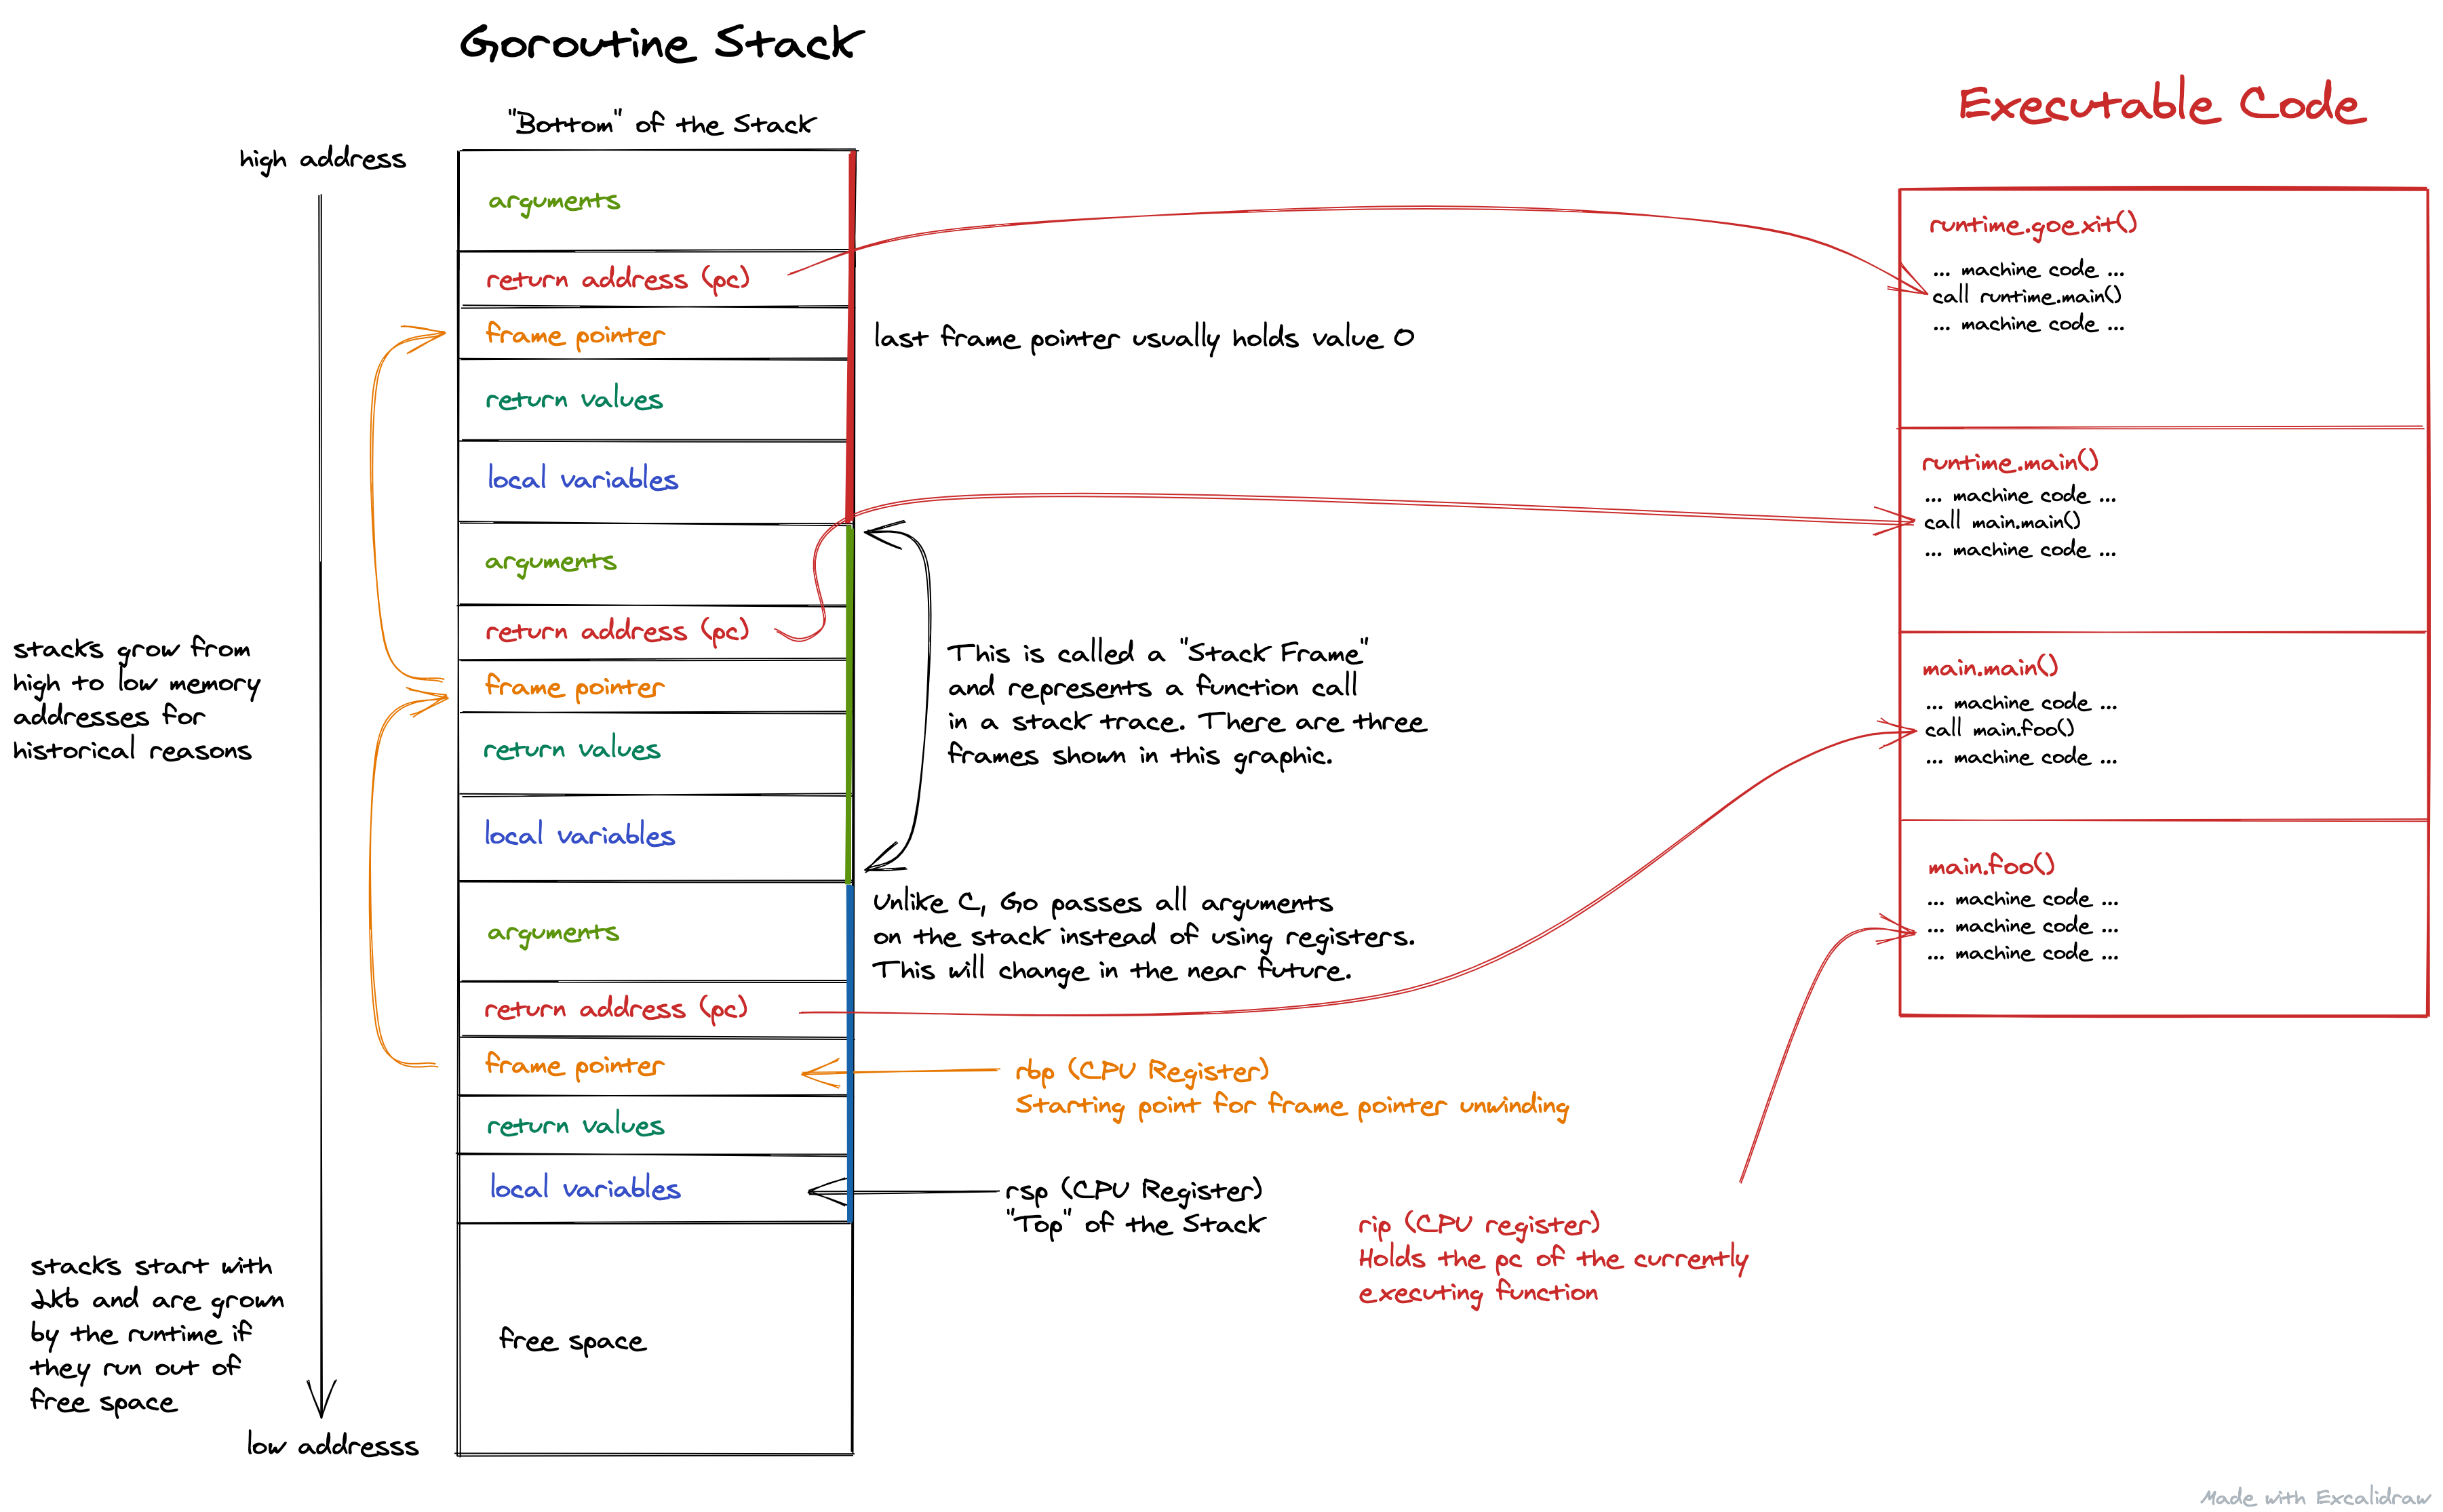
There is a lot going on in this picture, but for now let's focus on the things highlighted in red. To get a stack trace, the first thing we need is the current program counter (pc). This is found in a CPU register called rip (instruction pointer register) and points to another region of memory that holds the executable machine code of our program. Since we're currently calling main.foo() rip is pointing to an instruction within that function. If you're not familiar with registers, you can think of them as special CPU variables that are incredibly fast to access. Some of them, like rip, rsp or rbp have special purposes, while others can be used by compilers as they see fit.
Now that we know the program counter of the current function, it's time to find pc values of our callers, i.e. all the return address (pc) values that are also highlighted in red. There are various techniques for doing this, which are described in the Unwinding section. The end result is a list of program counters that represent a stack trace just like the one you can get from runtime.Callers(). Last but not least, these pc values are usually translated into human readable file/line/function names as described in the Symbolization section below. In Go itself you can simply calll runtime.CallerFramers() to symbolize a list of pc values.
Real Example
Looking at pretty pictures can be a good way to get a high level understanding of the stack, but it has its limits. Sometimes you need to look at the raw bits & bytes in order to get a full understanding. If you're not interested in that, feel free to skip ahead to the next section.
To take a look at the stack, we'll use delve which is a wonderful debugger for Go. In order to inspect the stack, I wrote a script called stackannotate.star that can used to print the annotated stack for a simple example program:
$ dlv debug ./examples/stackannotate/main.go
Type 'help' for list of commands.
(dlv) source delve/stackannotate.star
(dlv) continue examples/stackannotate/main.go:19
Breakpoint 1 set at 0x1067d94 for main.bar() ./examples/stackannotate/main.go:19
> main.bar() ./examples/stackannotate/main.go:19 (hits goroutine(1):1 total:1) (PC: 0x1067d94)
    14:	}
    15:
    16:	func bar(a int, b int) int {
    17:		s := 3
    18:		for i := 0; i < 100; i++ {
=>  19:			s += a * b
    20:		}
    21:		return s
    22:	}
(dlv) stackannotate
regs    addr        offset  value               explanation
        c00004c7e8       0                   0  ?
        c00004c7e0      -8                   0  ?
        c00004c7e8     -16                   0  ?
        c00004c7e0     -24                   0  ?
        c00004c7d8     -32             1064ac1  return addr to runtime.goexit
        c00004c7d0     -40                   0  frame pointer for runtime.main
        c00004c7c8     -48             1082a28  ?
        c00004c7c0     -56          c00004c7ae  ?
        c00004c7b8     -64          c000000180  var g *runtime.g
        c00004c7b0     -72                   0  ?
        c00004c7a8     -80     100000000000000  var needUnlock bool
        c00004c7a0     -88                   0  ?
        c00004c798     -96          c00001c060  ?
        c00004c790    -104                   0  ?
        c00004c788    -112          c00001c060  ?
        c00004c780    -120             1035683  return addr to runtime.main
        c00004c778    -128          c00004c7d0  frame pointer for main.main
        c00004c770    -136          c00001c0b8  ?
        c00004c768    -144                   0  var i int
        c00004c760    -152                   0  var n int
        c00004c758    -160                   0  arg ~r1 int
        c00004c750    -168                   1  arg a int
        c00004c748    -176             1067c8c  return addr to main.main
        c00004c740    -184          c00004c778  frame pointer for main.foo
        c00004c738    -192          c00004c778  ?
        c00004c730    -200                   0  arg ~r2 int
        c00004c728    -208                   2  arg b int
        c00004c720    -216                   1  arg a int
        c00004c718    -224             1067d3d  return addr to main.foo
bp -->  c00004c710    -232          c00004c740  frame pointer for main.bar
        c00004c708    -240                   0  var i int
sp -->  c00004c700    -248                   3  var s int
The script isn't perfect and there are some addresses on the stack that it's unable to automatically annotate for now (contributions welcome!). But generally speaking, you should be able to use it to check your understanding against the abstract stack drawing that was presented earlier.
If you want to try it out yourself, perhaps modify the example program to spawn main.foo() as a goroutine and observe how that impacts the stack.
Unwinding
Unwinding (or stack walking) is the process of collecting all the return addresses (see red elements in Stack Layout) from the stack. Together with the current instruction pointer register (rip) they form a list of program counter (pc) values that can be turned into a human readable stack trace via Symbolization.
The Go runtime, including the builtin profilers, exclusively use .gopclntab for unwinding. However, we'll start with describing Frame Pointer unwinding first, because it is much easier to understand and might become supported in the future.
Frame Pointer
Frame pointer unwinding is the simple process of following the base pointer register (rbp) to the first frame pointer on the stack which points to the next frame pointer and so on. In other words, it is following the orange lines in the Stack Layout graphic. For each visited frame pointer, the return address (pc) sitting 8 bytes above the frame pointer is collected along the way. That's it : ).
The main downside to frame pointers is that pushing them onto the stack adds some performance overhead to every function call during normal program execution. The Go authors estimated an average 2% execution overhead for an average program in the Go 1.7 release notes. Because of this compilers such as gcc offer options such as -fomit-frame-pointers to omit them for better performance. However, it's a devil's bargain: It gives you small performance win right away, but it reduces your ability to debug and diagnose performance issues in the future. Because of this the general advice is:
Always compile with frame pointers. Omitting frame pointers is an evil compiler optimization that breaks debuggers, and sadly, is often the default. – Brendan Gregg
In Go you don't even need this advice. Since Go 1.7 frame pointers are enabled by default for 64 bit binaries, and there is no -fomit-frame-pointers footgun available. This allows Go to be compatible with third party debuggers and profilers such as Linux perf out of the box.
If you'd like to see frame pointer unwinding in action, you can check out this tiny code snippet which is a fast alternative to the official runtime.Callers() implementation. The simplicity should speak for itself when compared to the other unwinding methods described below. It should also be clear that frame pointer unwinding has O(N) time complexity where N is the number of stack frames that need to be traversed.
Despite the apparent simplicity, frame pointer unwinding is no panacea. Frame pointers are pushed to the stack by the callee, so for interrupt based profiling there is a race condition that might cause you to miss the caller of the current function in your stack trace. Additionally frame pointer unwinding can't unwind inlined function calls. So at least some of the complexity of .gopclntab or DWARF is essential to enable accurate unwinding.
.gopclntab
Despite frame pointers being available on 64bit platforms, Go is not leveraging them for unwinding (this might change). Instead Go ships with its own idiosyncratic unwinding tables that are embedded in the .gopclntab section of any Go binary. .gopclntab stands for "go program counter line table", but this is a bit of a misnomer as it contains various tables and meta data required for unwinding and symbolization. For unwinding, the general idea is to embed a table that maps every program counter (pc) to the current distance (delta) of the stack pointer (rsp) from the nearest return address (pc) above it. The initial lookup uses the pc from the rip instruction pointer register and then uses the return address (pc) for the next lookup and so on.
Russ Cox initially described some of the involved data structures in his Go 1.2 Runtime Symbol Information document, but it's very outdated by now and it's probably better to look at the current implementation directly. The relevant files are runtime/traceback.go and runtime/symtab.go, so let's dive in.
There are various use cases for stack traces in Go, but they all end up hitting the gentraceback() function. If the caller is e.g. runtime.Callers() the function only needs to do unwinding, but e.g. panic() wants text output, which requires symbolization as well. Additionally the code has to deal with the difference between link register architectures such as ARM that work a little different from x86. This combination of unwinding, symbolization, support for different architectures and bespoke data structures might just be a regular day in the shop for the system developers on the Go team, but it's definitely been tricky for me, so please watch out for potential inaccuracies in my description below.
Each frame lookup begins with the current pc which is passed to findfunc() which looks up the meta data for the function that contains the pc. Historically this was done using O(log N) binary search, but nowadays there is a hash-map-like index of findfuncbucket structs that usually directly guides us to the right entry using an O(1) algorithm. So at this point the overall complexity is still the same as frame pointer unwinding, but it's worth noting that the constant overheads are already significantly higher.
The _func meta data that we just retrieved contains a pcsp offset into the pctab table that maps program counters to stack pointer deltas. To decode this information, we call funcspdelta() which does a O(N) linear search over all program counters of the function until it finds the (pc, sp delta) pair were are looking for. For stacks with recursive call cycles, a tiny program counter cache is used to avoid doing lots of duplicated work.
Now that that we have the stack pointer delta, we we are almost ready to locate the next return address (pc) value of the caller and do the same lookup for it until we reach the "bottom" of the stack. But before that, we need to check if the current pc is part of one or more inlined function calls. This is done by checking the _FUNCDATA_InlTree data for the current _func and doing another linear search over the (pc, inline index) pairs in that table. Any inlined call found this way gets virtual stack frame pc added to the list. Then we continue with return address (pc) as mentioned in the beginning of the paragraph.
Putting it all together, for non-recursive call stacks without inlining, the complexity for gopclntab unwinding is O(N*M) where N is the number of frames on the stack, and M is the average size of the generated machine code per function. This can be validated experimentally, but in the real world I'd expect the average N and M to be fairly similar for most non-trivial Go applications, so unwinding a stack (without symbolization) will generally cost 1-10µs. That being said, naive frame pointer unwinding appears to be 50x faster, and does less cache thrashing, so high-resolution profiling and tracing use cases would likely benefit from seeing support for it in the core.
Last but not least, it's worth noting that Go ships with two .gopclntab implementations. In addition to the one I've just described, there is another one in the debug/gosym package that seems to be used by the linker, go tool addr2line and others. If you want, you can use it yourself in combination with debug/elf or (debug/macho) as a starting point for your own gopclntab adventures for good or evil.
DWARF
An unwinder that is several hundred lines long is simply not even remotely interesting to me. – Linus Torvalds
... so as long as the Go compiler emits valid DWARF symbols, then anything is possible. Erm, by "anything" I mean, specificially, "unwinding". Many things are still not possible, even with DWARF (and more frequently than you might think, many things are not possible precisely because DWARF exists-- true love, for instance) – David Sanchez (my colleague, who knows more about DWARF than any sane person probably should)
ORC, LBR, etc.
Symbolization
To be written ...
Overhead
To be written ...
- Frame Pointers: 2% for Go, Linux 5-10%
In fact, until recently, the Linux Kernel rejected anything other than frame pointers for stack unwinding despite causing up to 5-10% slowdown for some workloads. Go reported the overhead as 2% in the Go 1.7 release notes.
File size.
Accuracy
To be written ...
Function Inlining
Frame Pointer Race Condition
To be written ...
Goroutine Stack Truncation
To be written ...
cgo
To be written ...
pprof Labels
To be written ...
History
In order to support 3rd profilers such as perf the Go 1.7 (2016-08-15) release started to enable frame pointers by default for 64bit binaries.
Disclaimers
I'm felixge and work at Datadog on Continuous Profiling for Go. You should check it out. We're also hiring : ).
The information on this page is believed to be correct, but no warranty is provided. Feedback is welcome!