1.5 KiB
Stack Traces in Go
Stack traces play a critical role in Go profiling. So let's try to understand them to see how they might impact the overhead and accuracy of your profiles.
Introduction
All Go profilers work by collecting samples of stack trace and putting them into pprof profiles. Ignoring some details, a pprof profile is just a frequency table of stack traces like shown below:
| stack trace | count |
|---|---|
| main;foo | 5 |
| main;foo;bar | 3 |
| main;foobar | 4 |
Let's zoom in on the second stack trace in the table above: main;foo;bar. A Go developer will usually be more familiar with seeing a stack trace like this as rendered by panic() or runtime.Stack() shown below:
goroutine 1 [running]:
main.bar(...)
	/path/to/go-profiler-notes/examples/stack-trace/main.go:17
main.foo(...)
	/path/to/go-profiler-notes/examples/stack-trace/main.go:9
main.main()
	/path/to/go-profiler-notes/examples/stack-trace/main.go:5 +0x3a
This text format has been described elsewhere so we won't discuss the details of it here. Instead we'll dive even deeper and ask ourselves where this data is coming from.
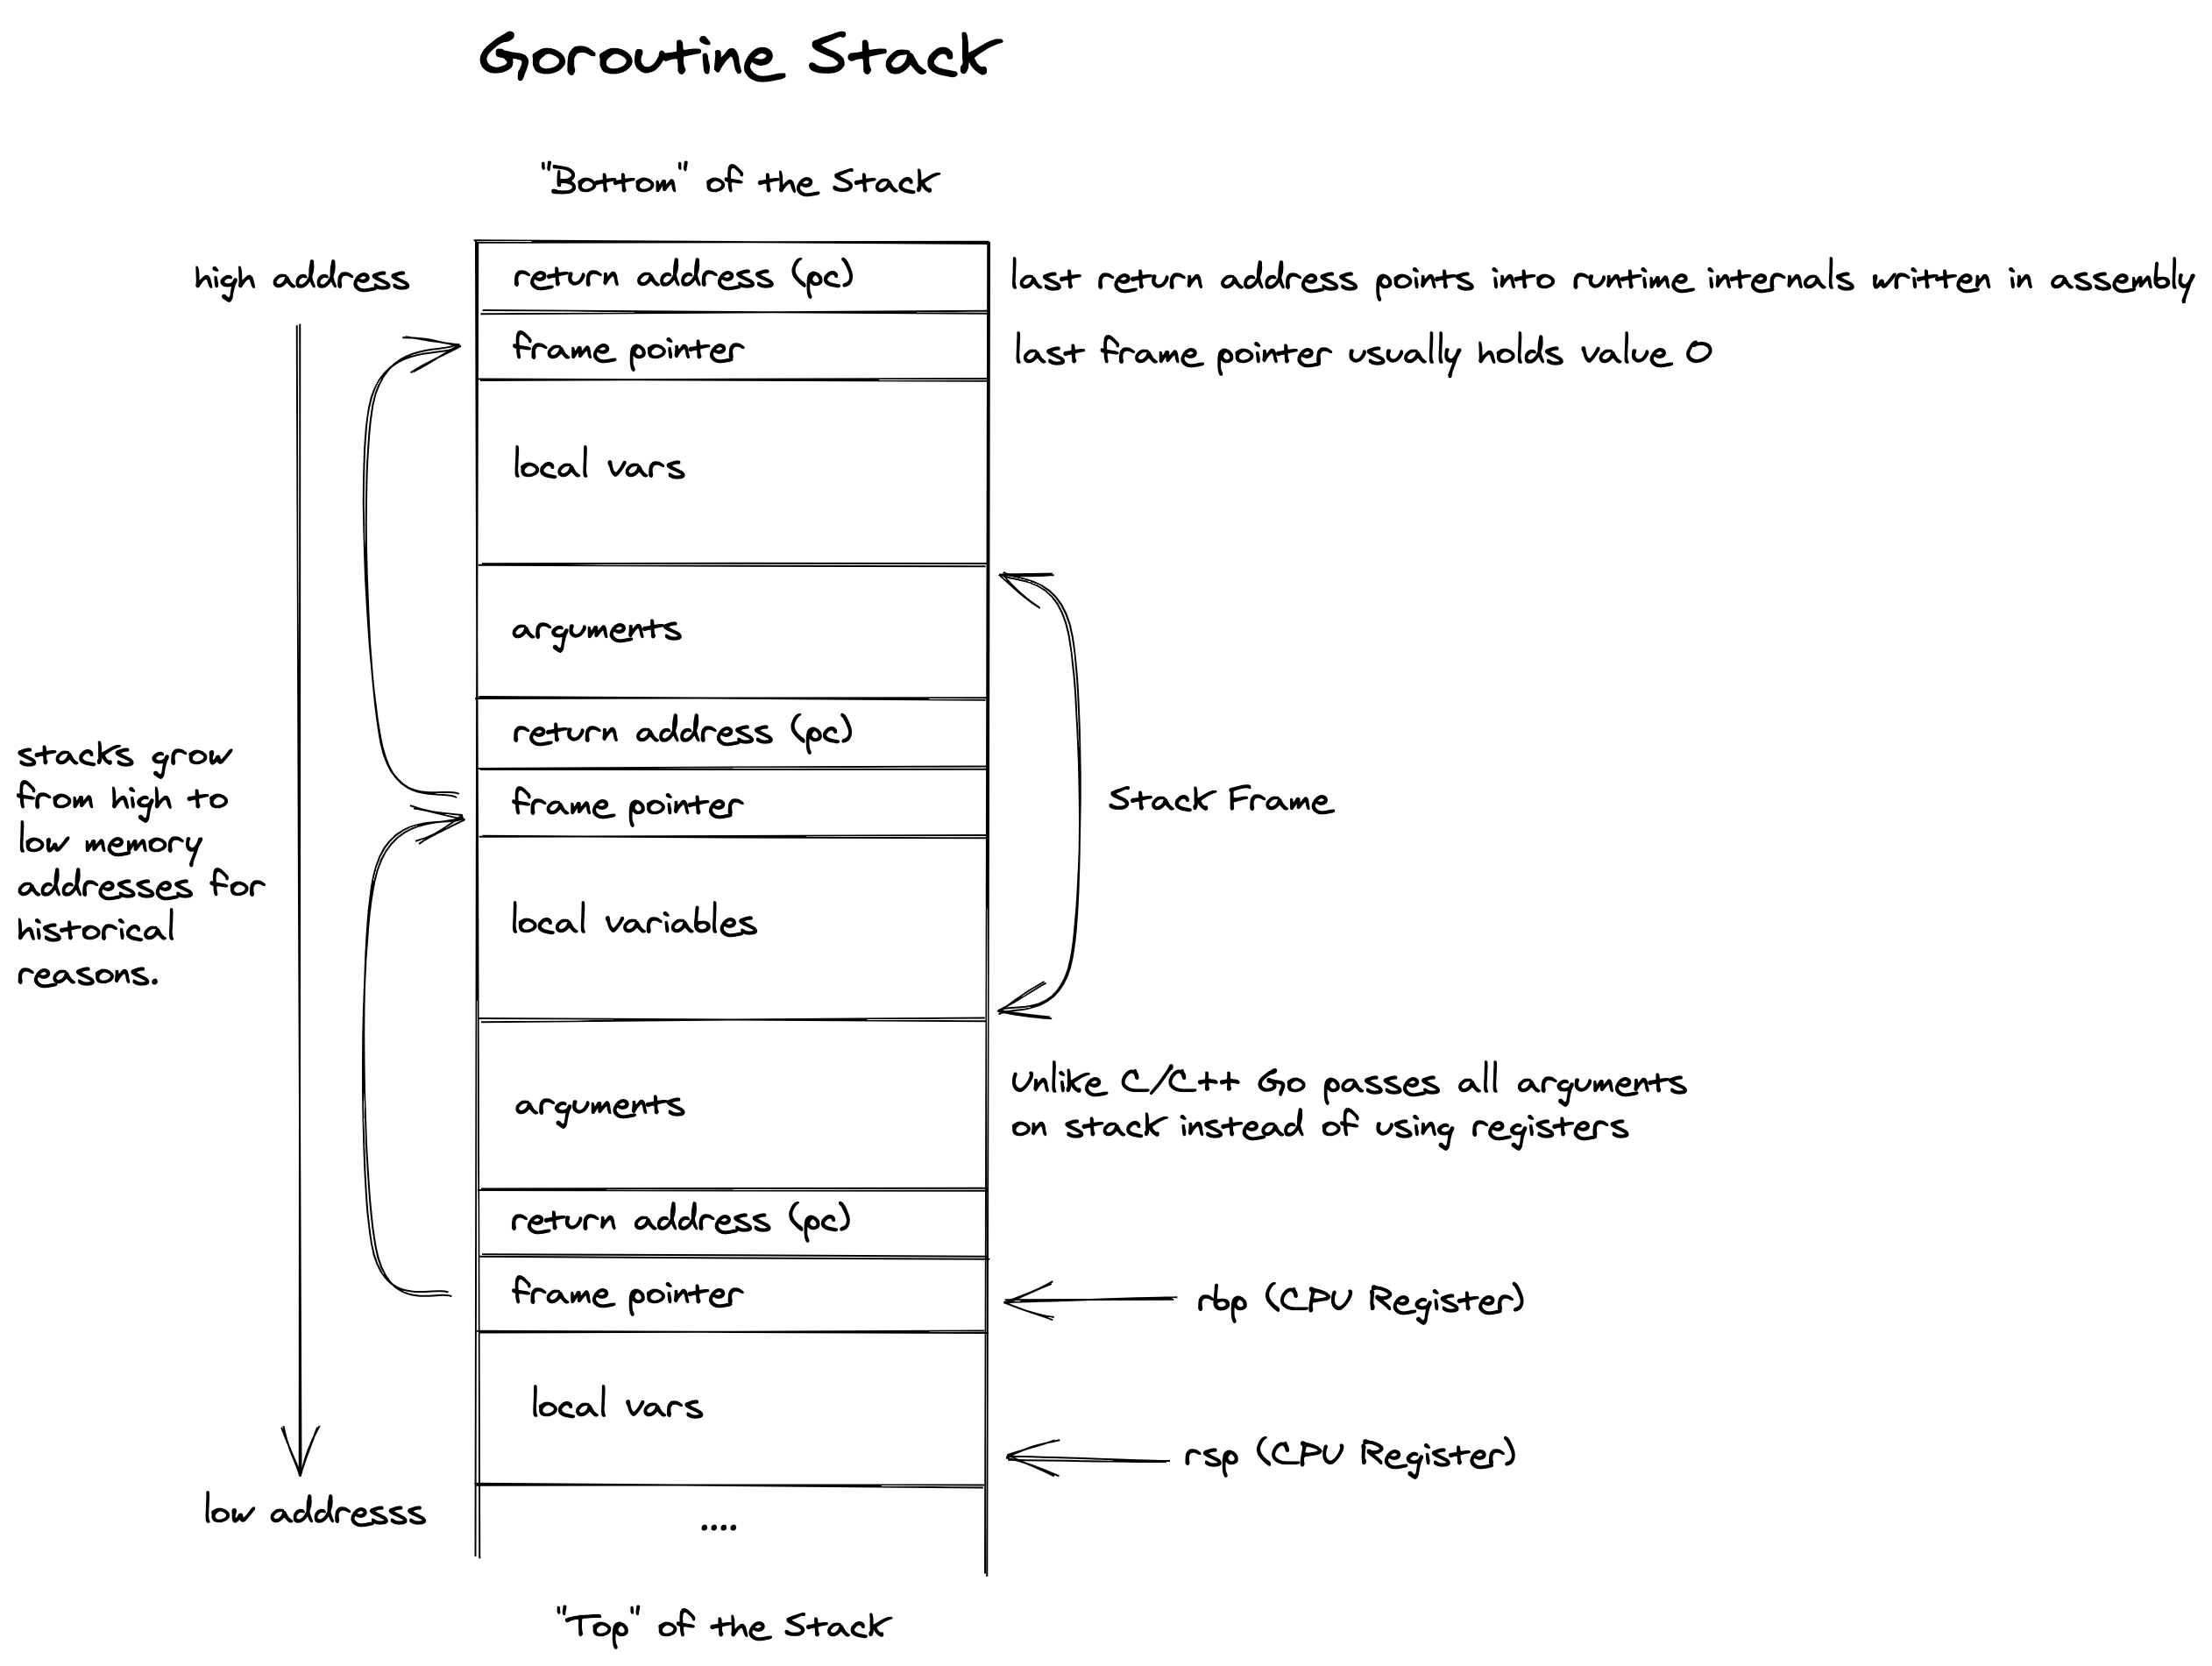
Goroutine Stack
Stack traces
Stack Unwinding
Frame Pointers
To write ...
.gopclntab
To write ...
DWARF
To write ...
Symbolization
Woho
Overhead
To write ...
Accuracy
To write ...